A visual field report
What 30 seconds of standing still reveals
Hold a phone to your chest and stand quietly, and it records the tiny, constant corrections your body makes to stay upright. We turned those wobbles — from Wobble's first users — into pictures. Here is what the data shows so far.
- ~15 min read
Background
How the check works
Standing perfectly still is impossible. Your body is always making tiny adjustments — the same small motions you'd make balancing a broom on your palm. The phone sits flat against your chest, and because your chest tilts as you sway, the phone's motion sensor traces the path of your wobble for about half a minute.
Your balance leans on three senses working together: your eyes, the pressure and stretch sensors in your feet and joints, and your inner ear. The check deliberately switches some off, one at a time, to see how well the others cope.
So the check runs four times, flipping two switches: eyes open or closed (vision on/off) and firm floor or soft foam (reliable foot feedback on/off). Foam scrambles the signal from your feet, much as closing your eyes removes sight.
1 · The dataset
Our data so far
Before any finding, the honest part: this is a small, young dataset. Wobble's iPhone app first reached the App Store on 13 May 2026, and the Android version is still in closed testing on Google Play — so at the time of writing the app has been public for only a few weeks. Uploads are opt-in, so what we have is a handful of curious early users, not a representative sample of anybody.
2 · What the data already shows
Four things you can already see
The deeper "for the curious" layers are tucked into expandable panels, so a normal read flows straight past them.
2.1 · The shape of a single check
One round of standing isn't a single number — it's five at once. We measure how busy your sway is (mean velocity), how far it drifts (sway amplitude), its rhythm (centroidal frequency), how jerky it is (jerk), and the size and shape of the area it covers (the sway ellipse). Drawn on five spokes, they form a little shape — a fingerprint of that round.
Not sure what "jerk" or "centroidal frequency" mean? Open any measure to see what a low and a high value look like — and which one is steadier.
Mean velocity — how busysee how
Adds up the whole length of your wobble trail and divides by the time — how far your sway travels each second. A high number means lots of busy little corrections, non-stop.
✓ steadier
Sway amplitude — how farsee how
How far from your average centre you usually stray — the radius of your typical wandering, ignoring how fast you got there. The dashed ring is that radius, like a dartboard around the bullseye — a tight one, or a wide one.
✓ steadier
Centroidal frequency — slow drift vs fast jittersee how
The pace of your sway — a few slow, lazy drifts, or lots of quick little jitters. Like big, slow ocean swells versus choppy ripples; it's about how often the sway reverses, not how big it is.
Neither extreme is simply "better" — rhythm describes the style of your sway, not how much you sway.
Jerk — smooth vs suddensee how
How abrupt your corrections are — gliding smoothly back to centre, or snapping back with sudden jolts. Like a driver who eases on and off the pedals versus one who stamps them and lurches you about.
✓ steadier
Sway ellipse — size & shapesee how
The smallest oval that covers 95% of where your sway went. A bigger oval covers more ground; its shape also hints whether you wobble more one way than the other (it's usually taller than wide — people drift more front-to-back). Like a sprinkler's wet patch on the lawn.
✓ steadier
So how does that fingerprint change across the four rounds? Here are all four on one radar:
New to this kind of chart? Here's how to read it
- Each spoke is one measure. The five arms are the five numbers above. A point near the centre means a little of that measure — steadier; out toward the edge means a lot — more sway.
- The shape is the story. Join the five points into a shape: a bigger shape means more sway overall, while a lopsided one tells you how a person wobbles, not just how much.
- The dark pentagon is your fixed yardstick. It's the cohort's overall typical check, and it's the same on every chart below — so you can compare the charts at a glance. Watch where each condition sits relative to it.
- The soft band is the normal spread. It shows how much people differ on each spoke. When two bands overlap heavily, the two conditions are genuinely hard to tell apart.
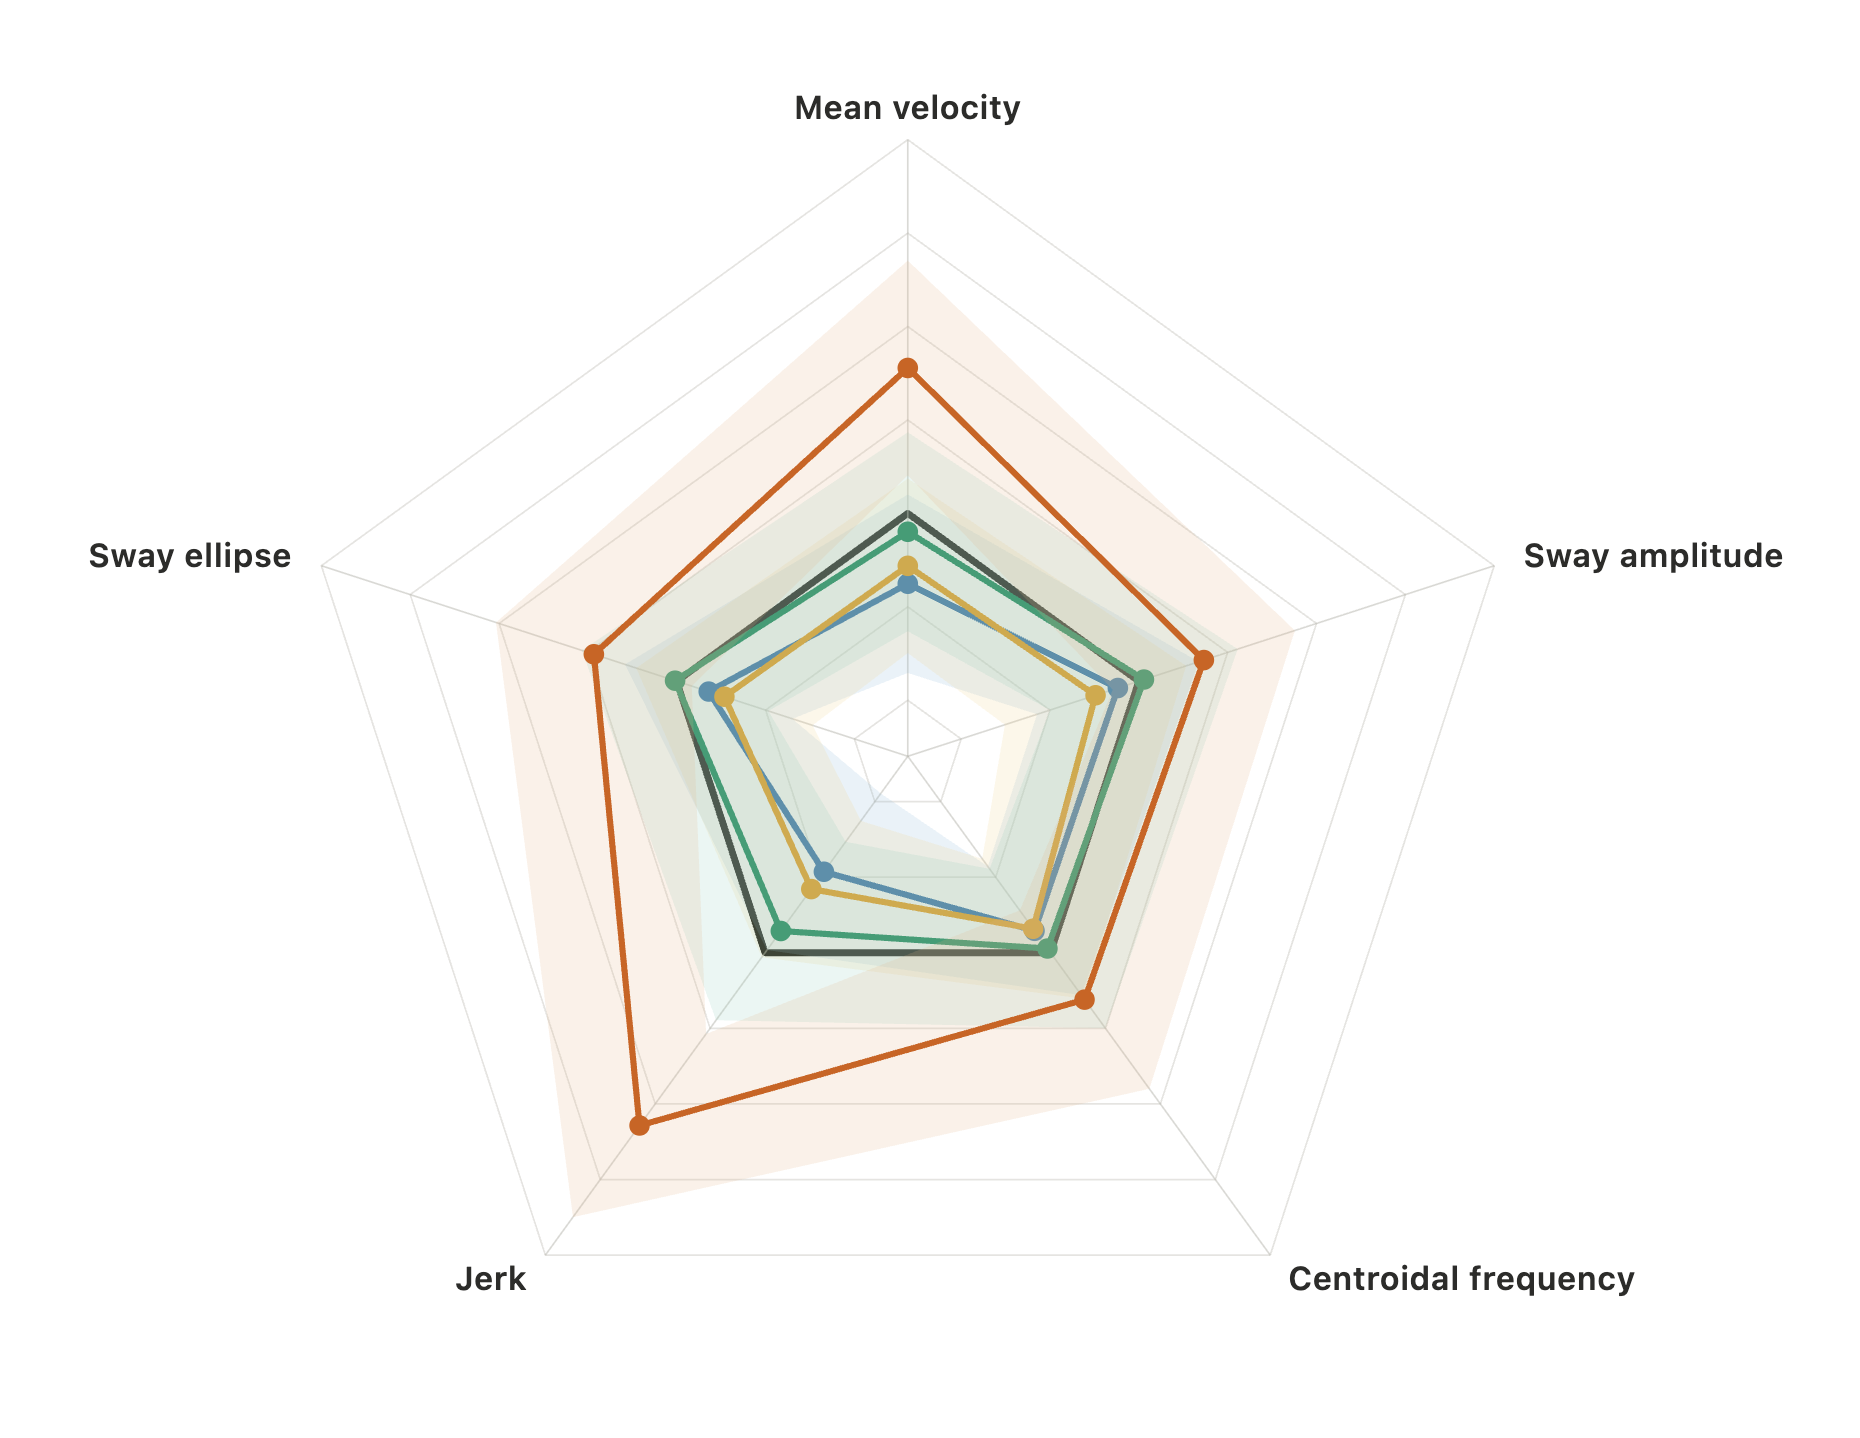
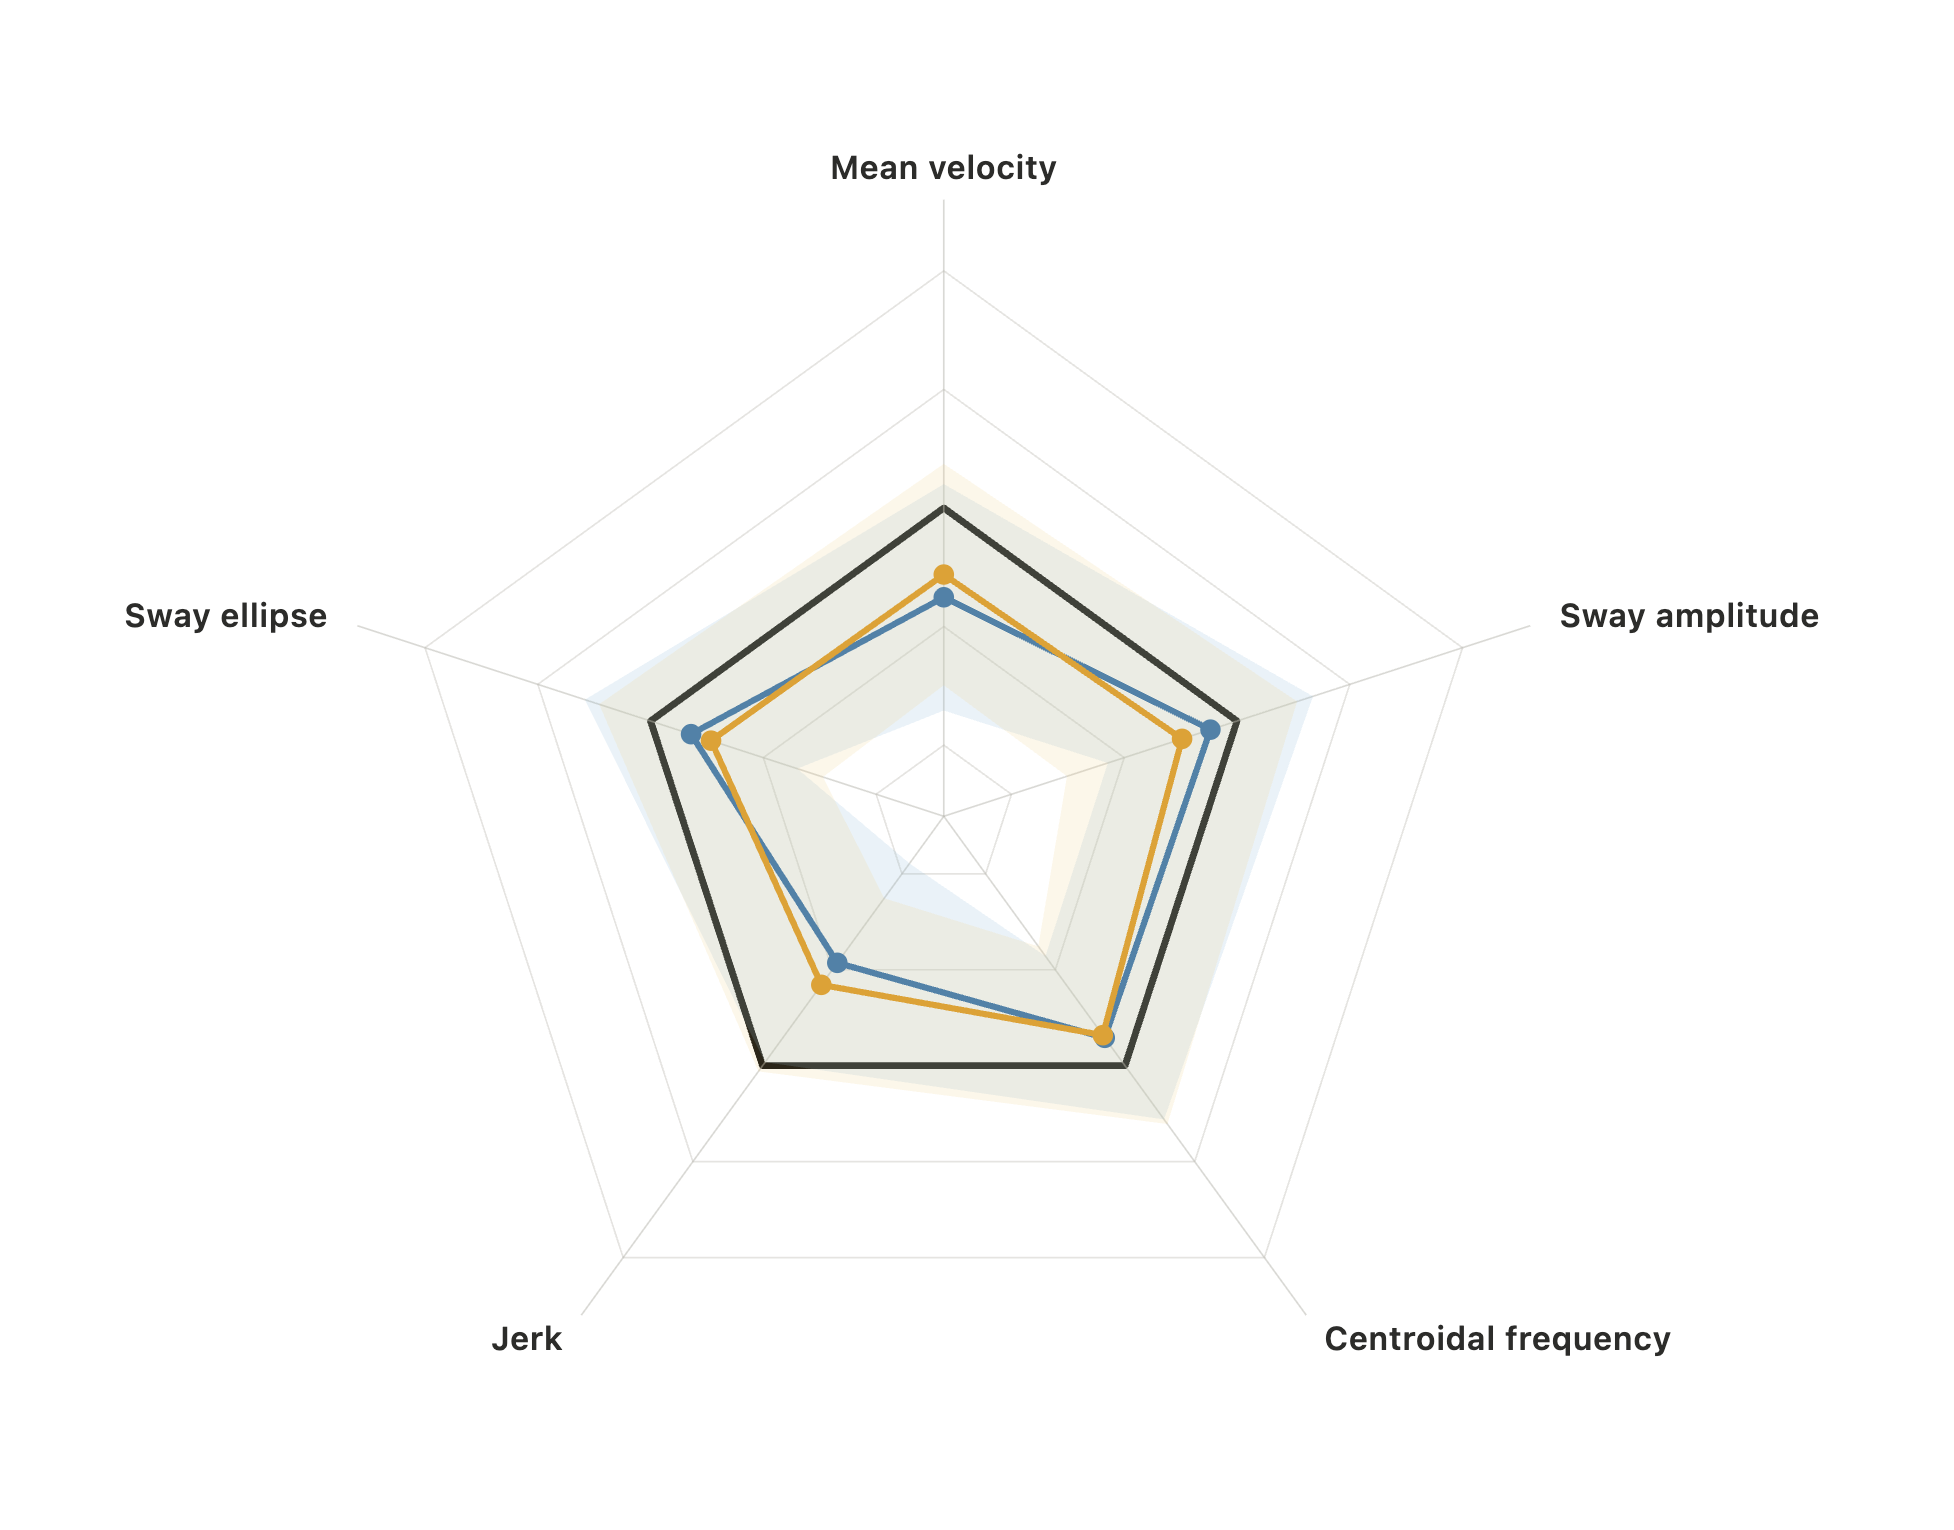
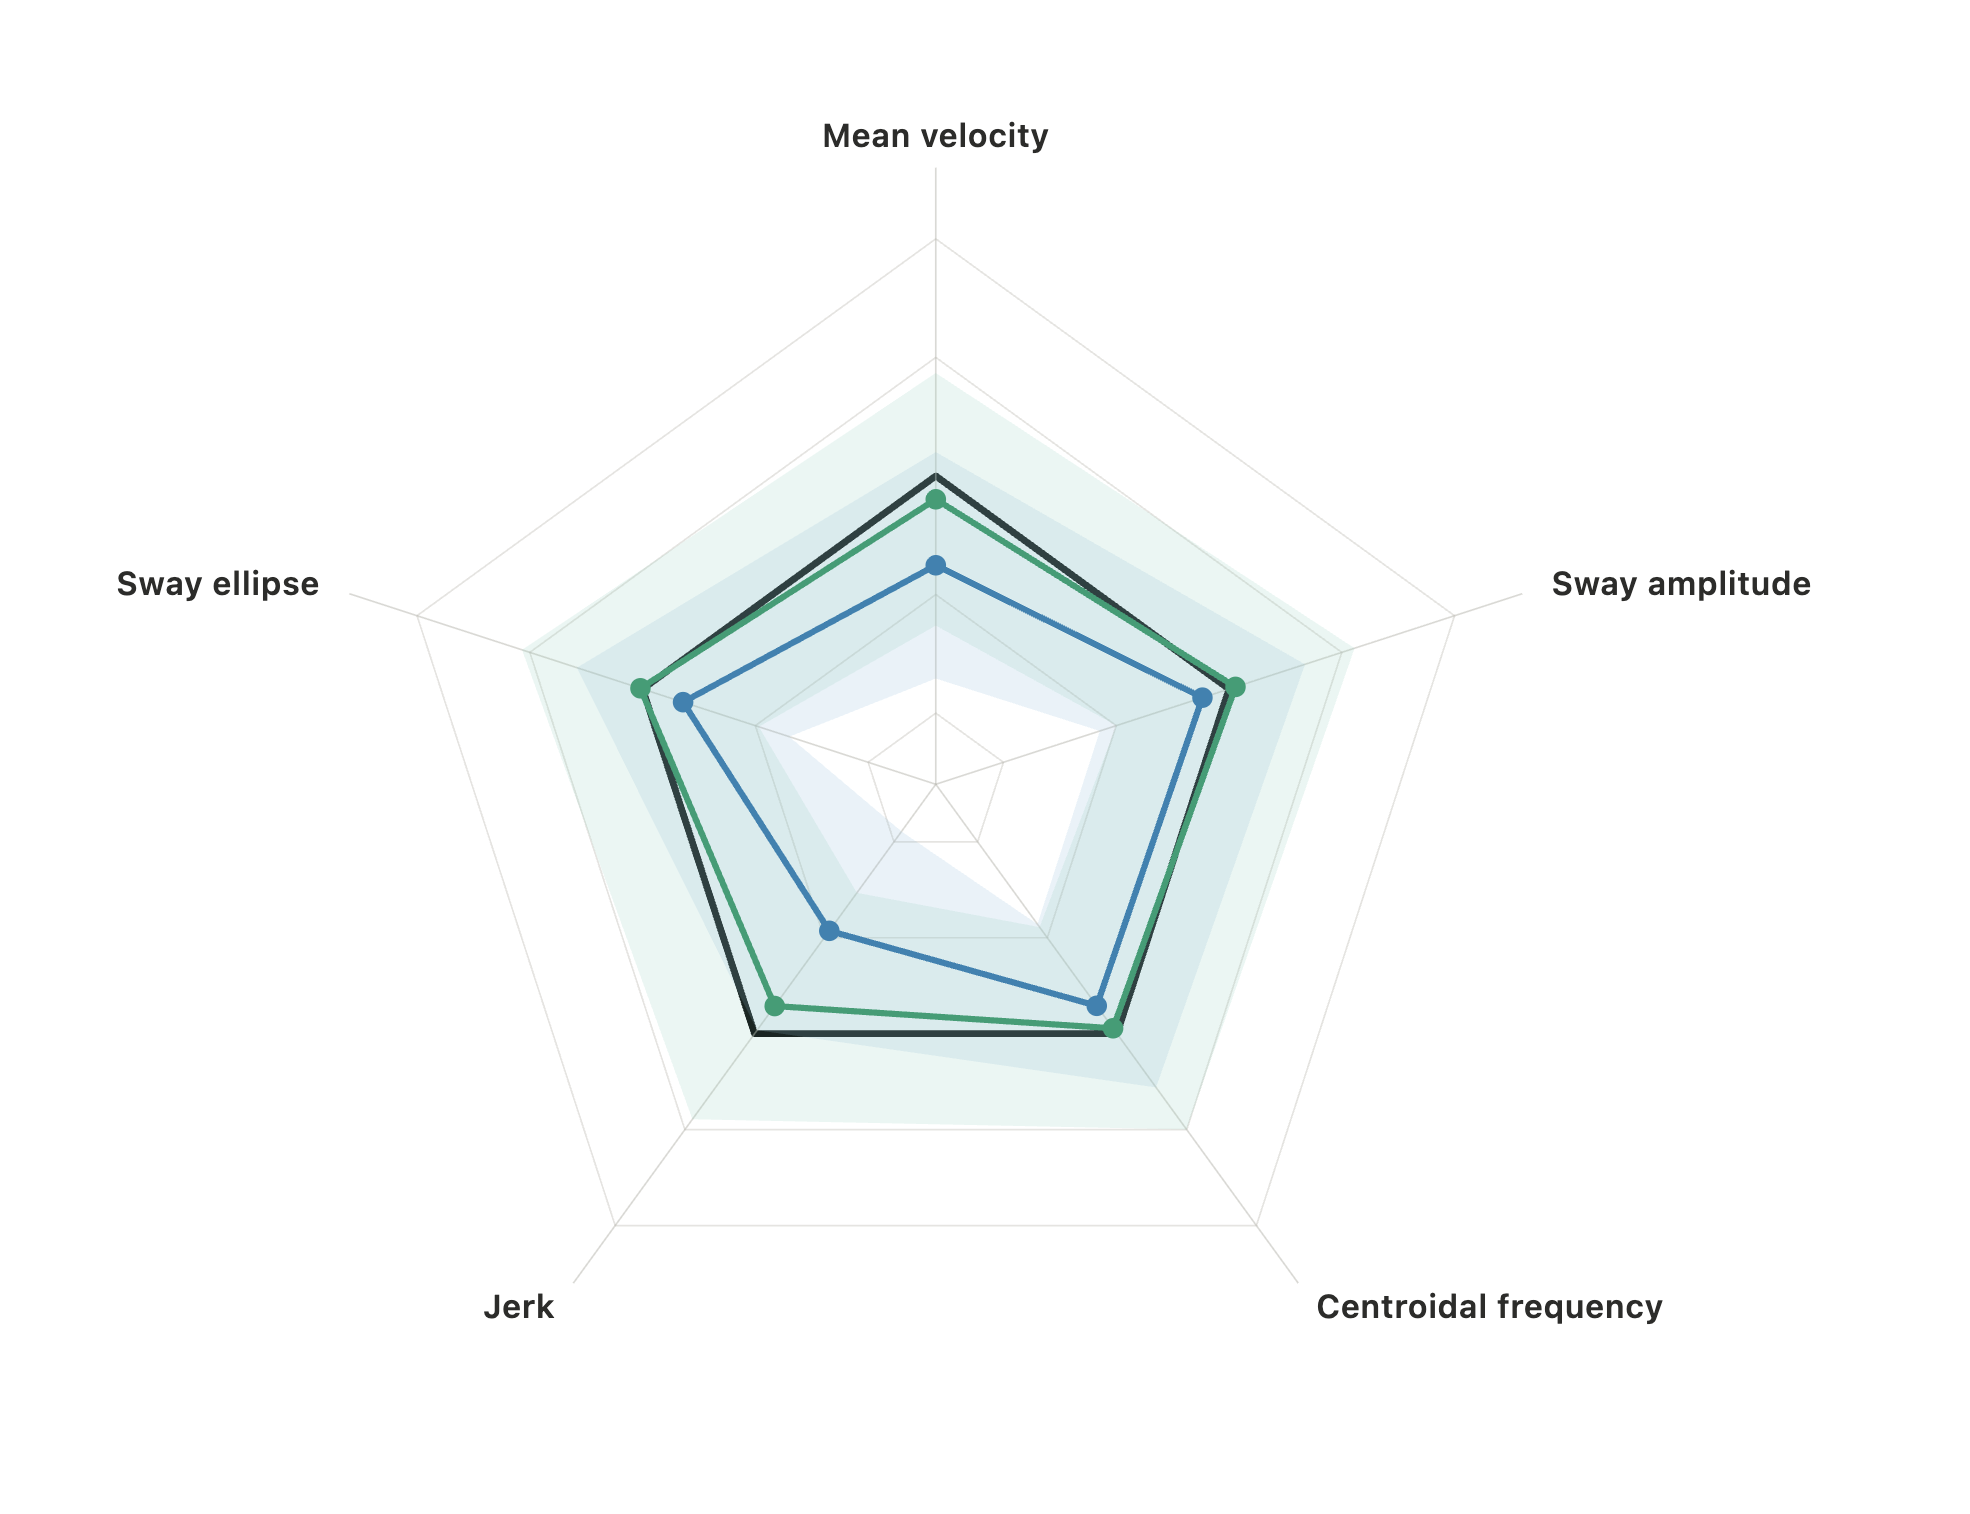
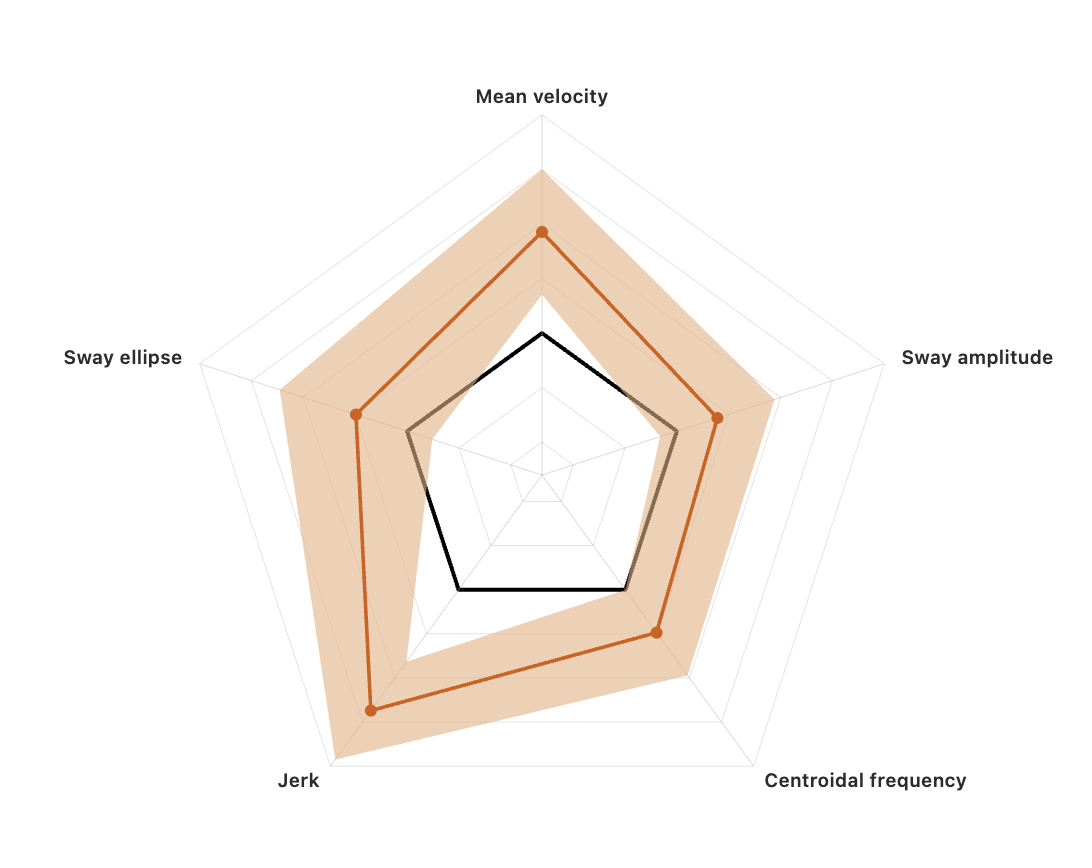
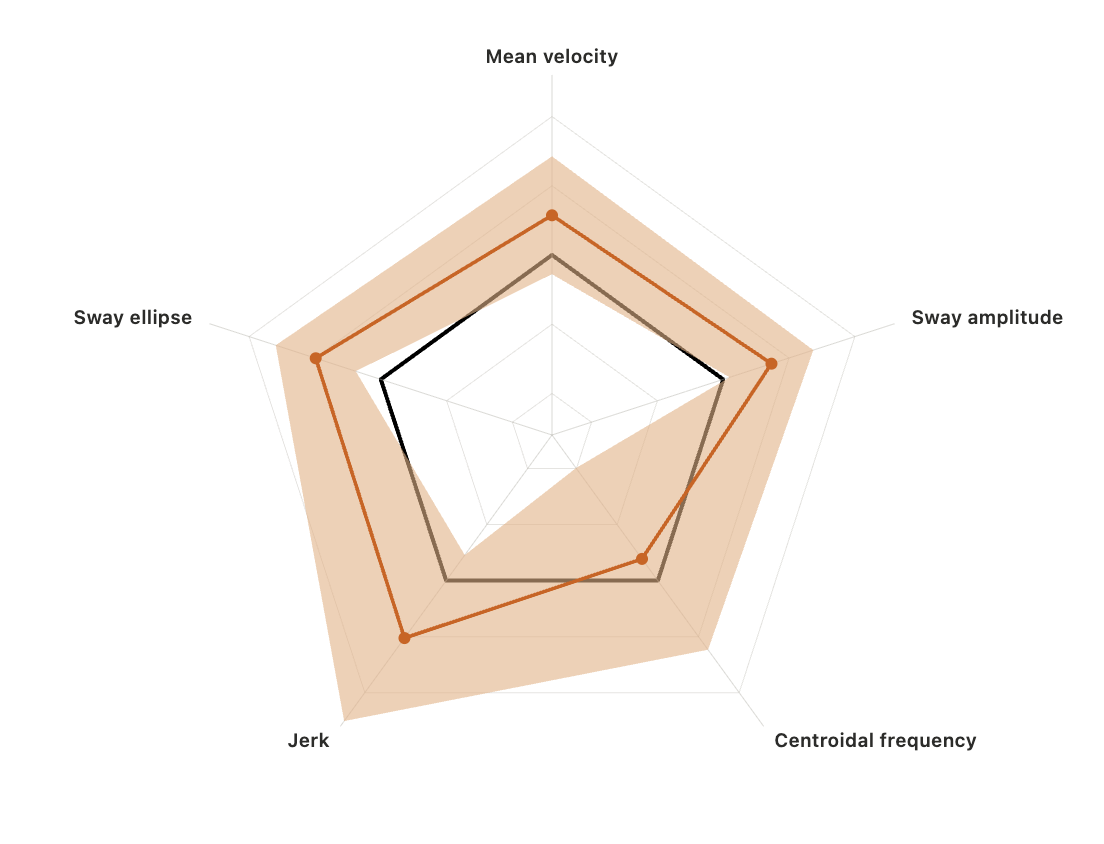
Each chart below zooms in on one pair, always against the easy baseline — firm ground, eyes open (C1), the blue outline.
Firm ground: eyes open vs eyes closed (C1 vs C2)
Eyes open: firm ground vs foam (C1 vs C3)
Firm ground, eyes open vs foam, eyes closed — the easy round vs the hardest (C1 vs C4)
Put together: the three easier rounds are near-neighbours that share a lot of overlap, while foam with eyes closed (C4) is the one round that stands apart — and there's a tidy reason. Balance runs on three senses, but any two of them carry more than enough signal to keep you upright; the third is spare capacity. Knock out just one — close your eyes (C2), or stand on foam (C3) — and the other two cover for it, which is why those rounds barely budge from firm ground with eyes open (C1). Knock out two at once — eyes shut and foam, which is foam with eyes closed (C4) — and you're down to the inner ear alone, with no backup. That's the round where balance finally gets hard.
2.2 · Foam pillow vs. the standard pad
Clinics use a firm, standardized foam pad (an Airex-style block). At home, people stand on whatever soft thing they have — often a couch cushion or pillow. A natural worry: does a softer pillow even count as the same test?
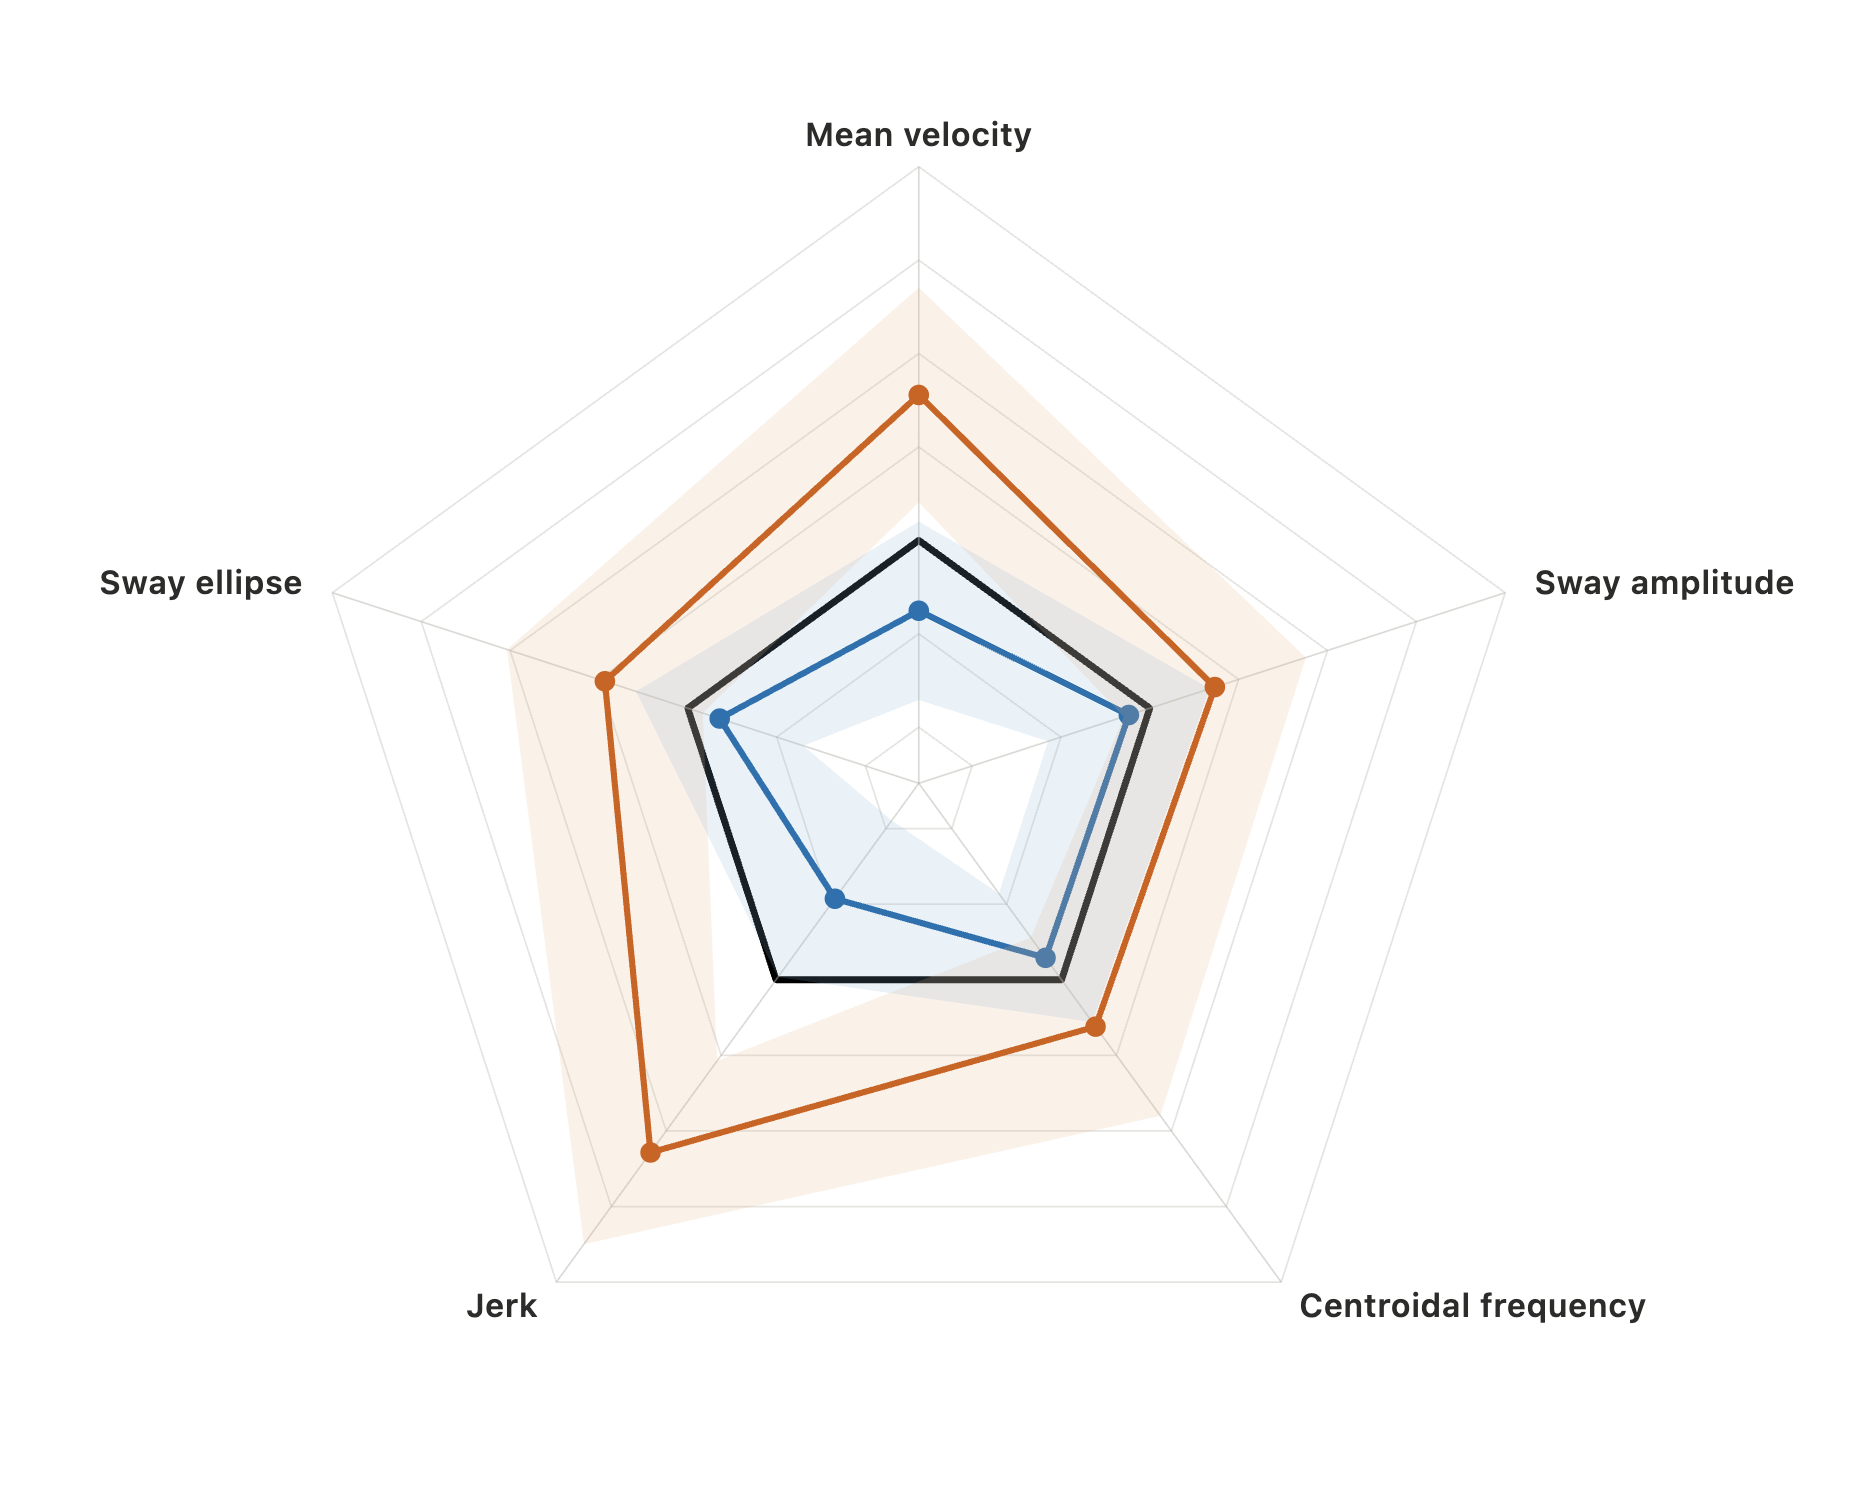
Our early read — now with a first look at the data — is that a pillow is a milder challenge than the clinical pad, but it disturbs balance in a similar way — the sway fingerprint keeps its shape, just turned down a notch. Here's the hardest round (foam, eyes closed) on each surface, against the all-conditions average:
On the Airex pad
On a pillow
Both surfaces clearly stress balance more than firm ground, so a pillow is a valid stand-in. The difference is how much — and it isn't a single number: each measure shifts by its own amount. Here's that gap for one of them, mean velocity, lining up the people who stood on both surfaces:
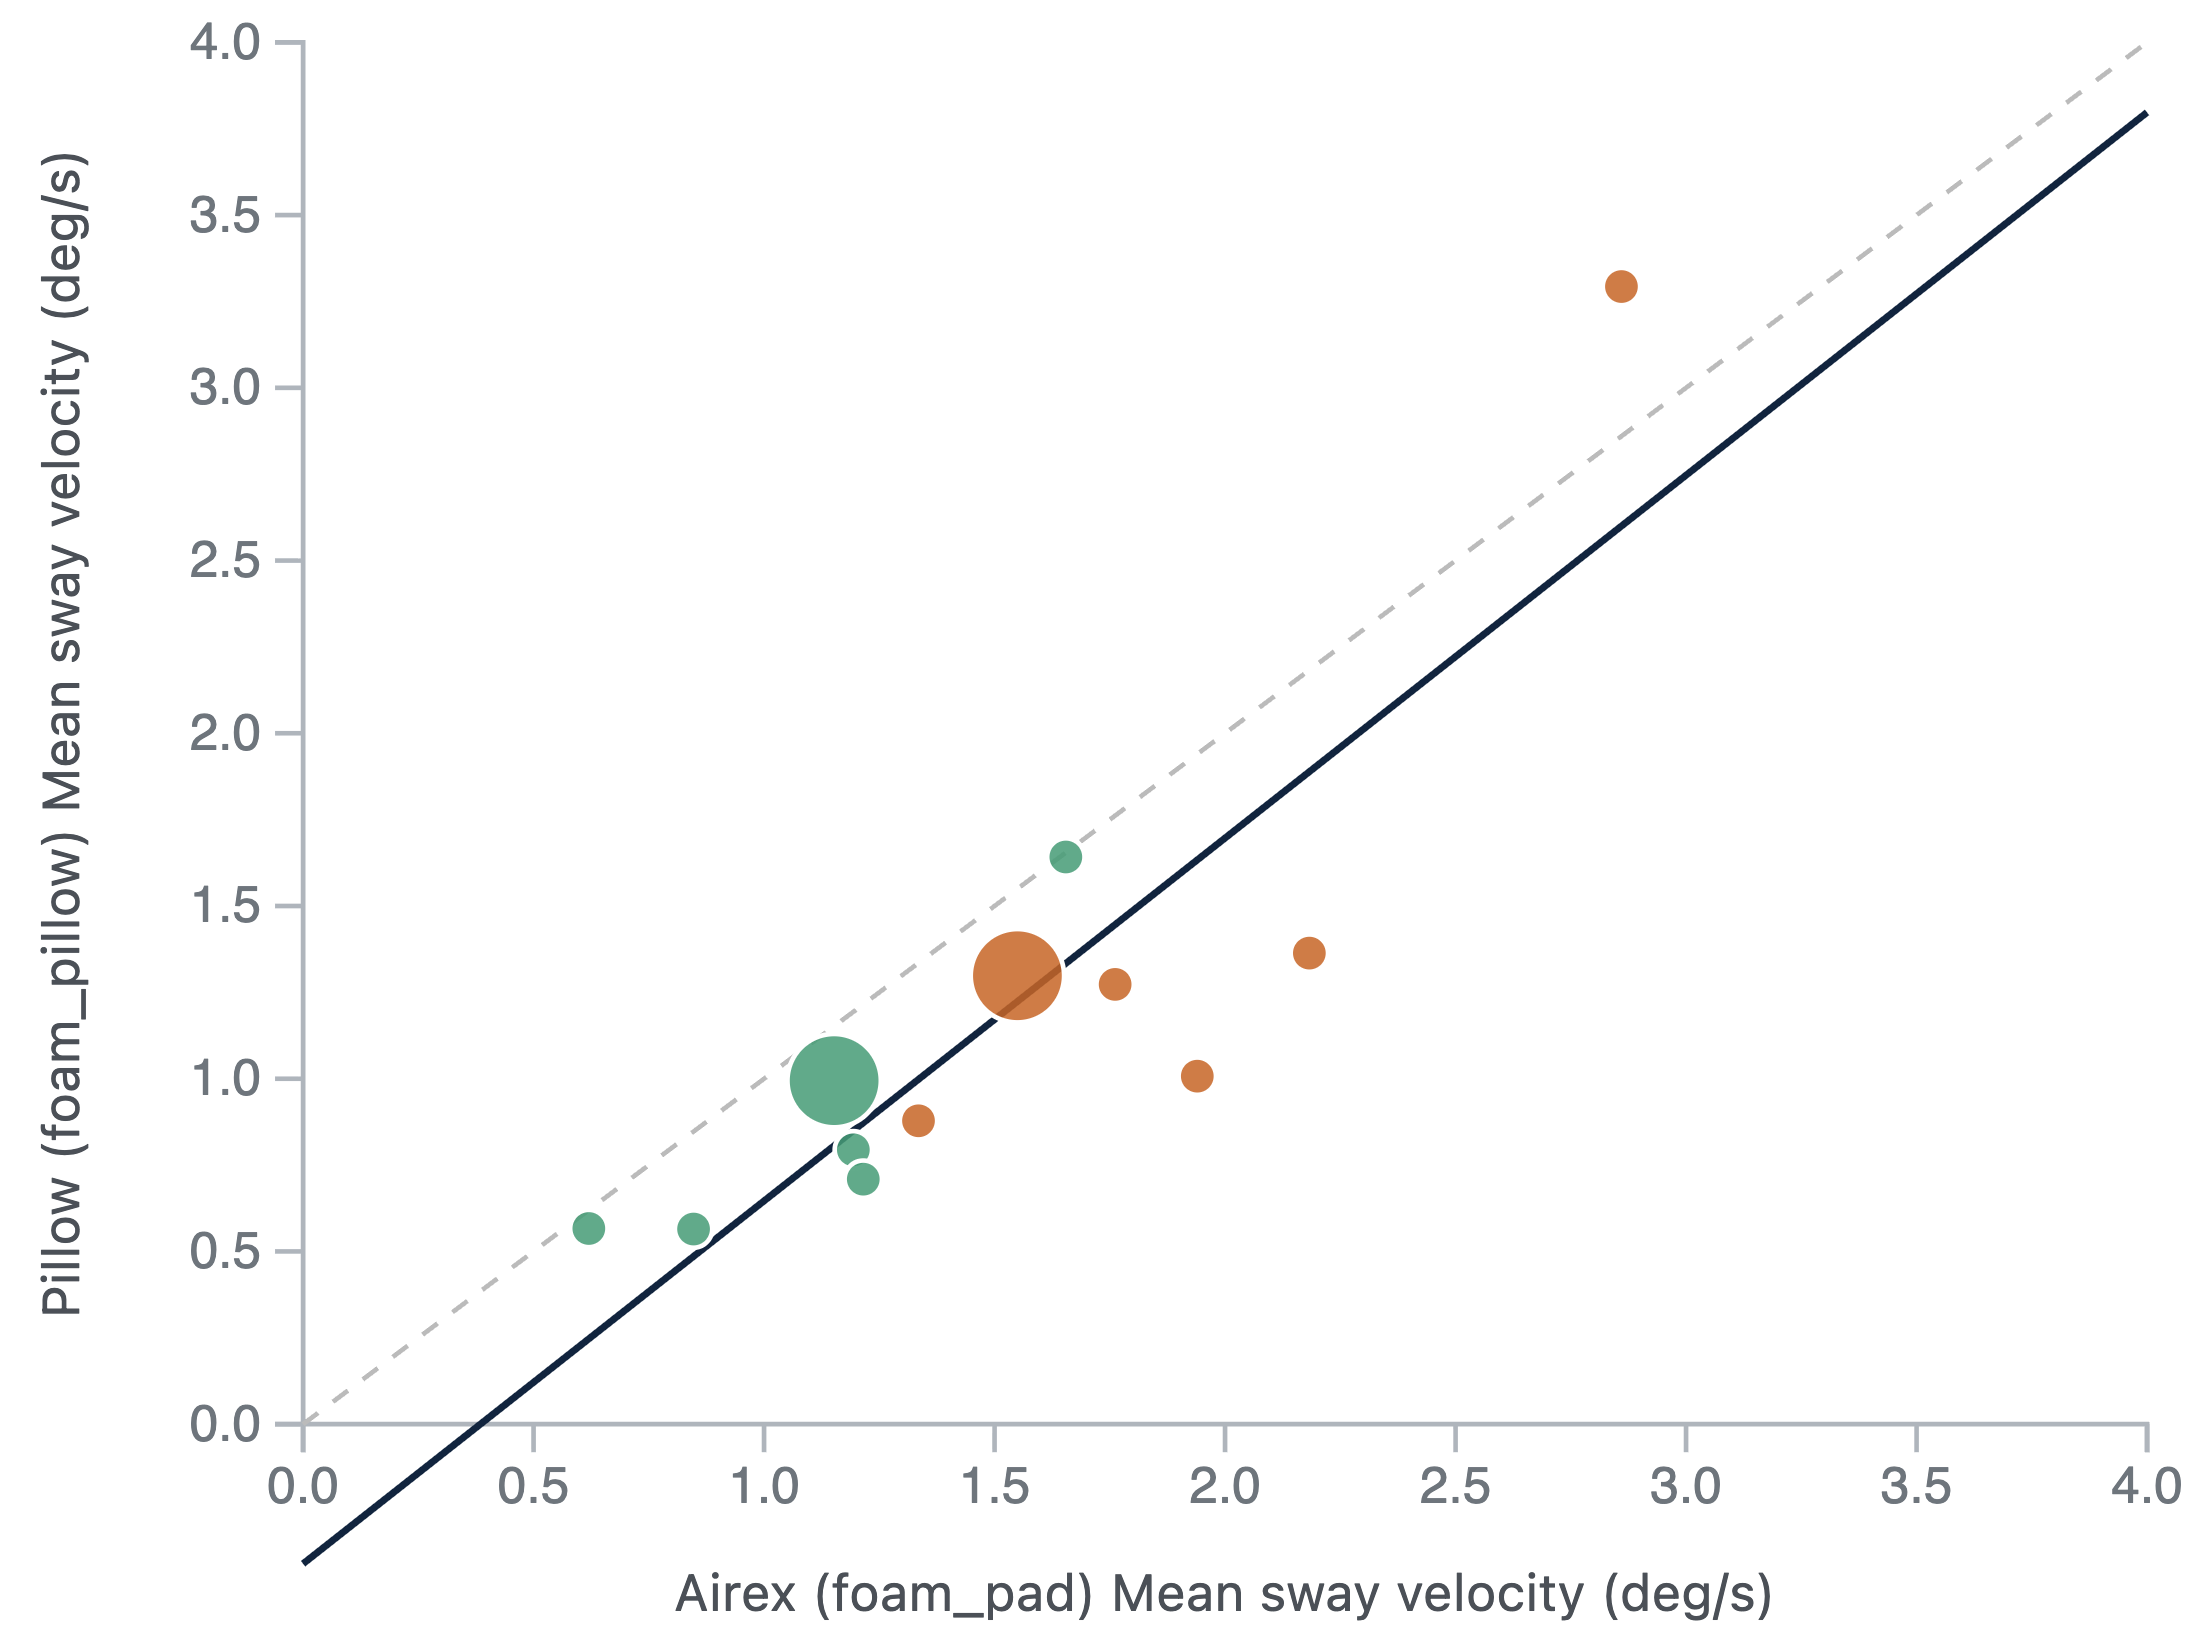
How Wobble will handle it. The shift isn't one number — on a pillow, each measure drops by a different amount. So the planned fix corrects every metric on its own, by its typical pad-to-pillow gap — the per-spoke difference between the two radars above. The scatter zooms in on just one of those measures, mean velocity (where the gap is about 0.4 deg/s), because a single metric is easy to picture in 2-D; the other four are handled the same way. The part a correction can't fix: no two pillows are alike, so a pillow adds more scatter than a standardized pad — shifting each average back is one thing, removing the extra noise is another. This is early, thin data and will firm up as more people upload both surfaces. Bottom line: a pillow is fine for tracking yourself over time, but for the cleanest, most comparable numbers, stand on a real Airex-style pad.
2.3 · Which sense is carrying you
Here's where the four rounds pay off. Sway almost always grows as we remove a sense — but how much it grows at each step points a finger at which sense you were leaning on. We measure that with simple ratios: "How many times worse did I get when we took something away?"
| The comparison | A big value means… |
|---|---|
| Eyes-shut jump (firm floor) | you rely heavily on your eyes to stay steady. |
| Soft-floor jump (eyes shut) | with sight off and feet scrambled, you're down to your inner ear — and it may be working hard. |
| Soft-floor jump (eyes open) | how well you tolerate an unstable surface while you can still see. |
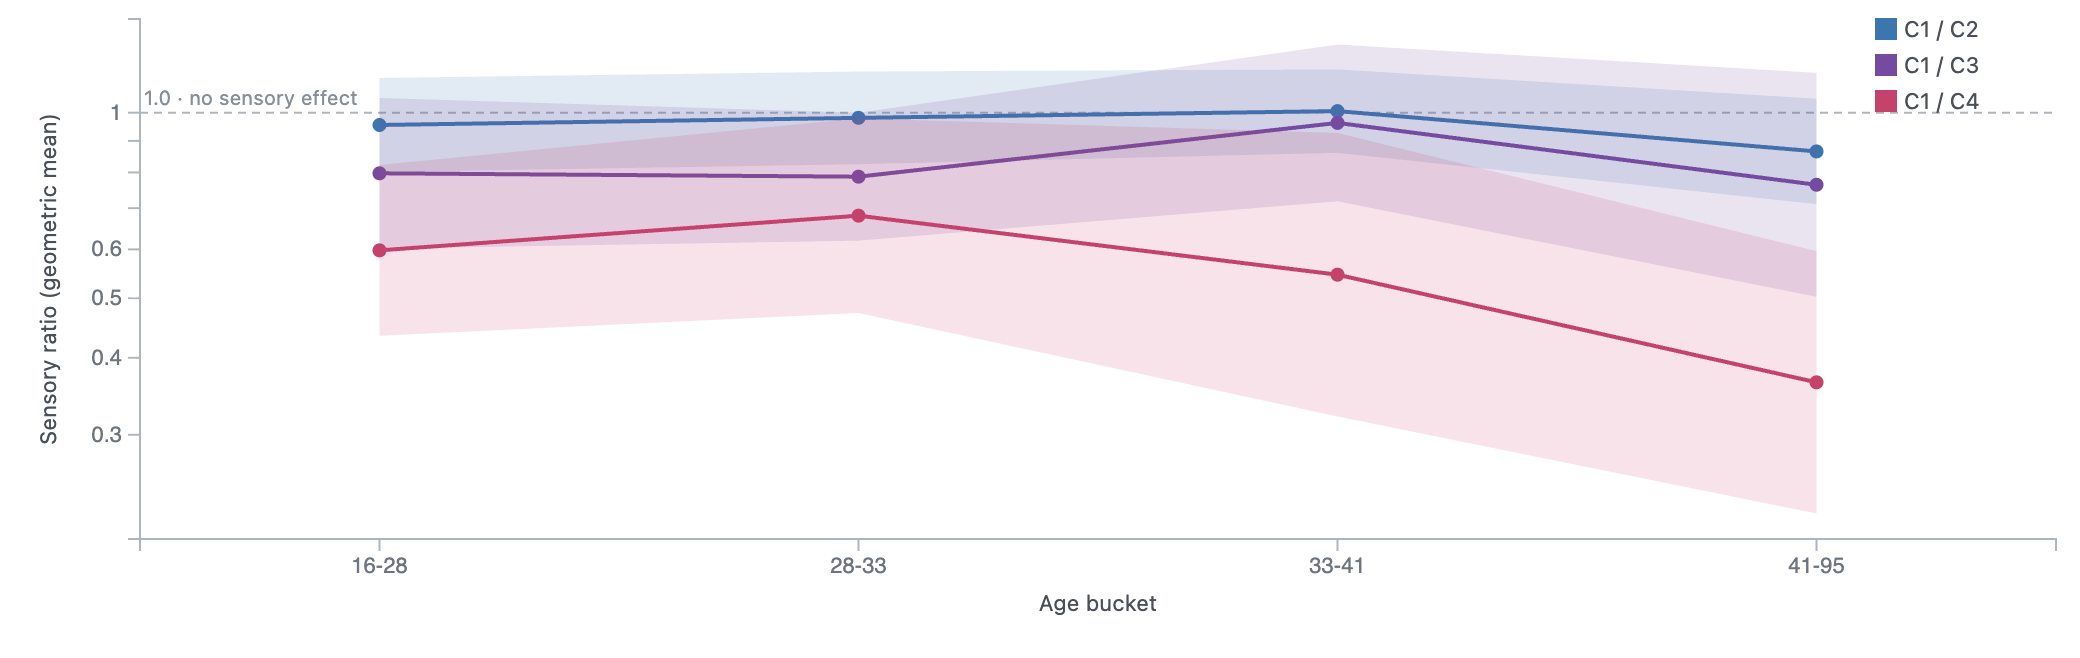
Turn each jump into a single number and you get a sensory ratio: the easy round divided by a harder one. A value of 1.0 means "no cost" — taking that sense away added no sway at all. The bigger the jump, the further the ratio falls below 1.0. Here is what the cohort looks like so far, split into four age groups:
Another way to look at the same question — which sense carries you — maps it straight onto the three senses themselves:
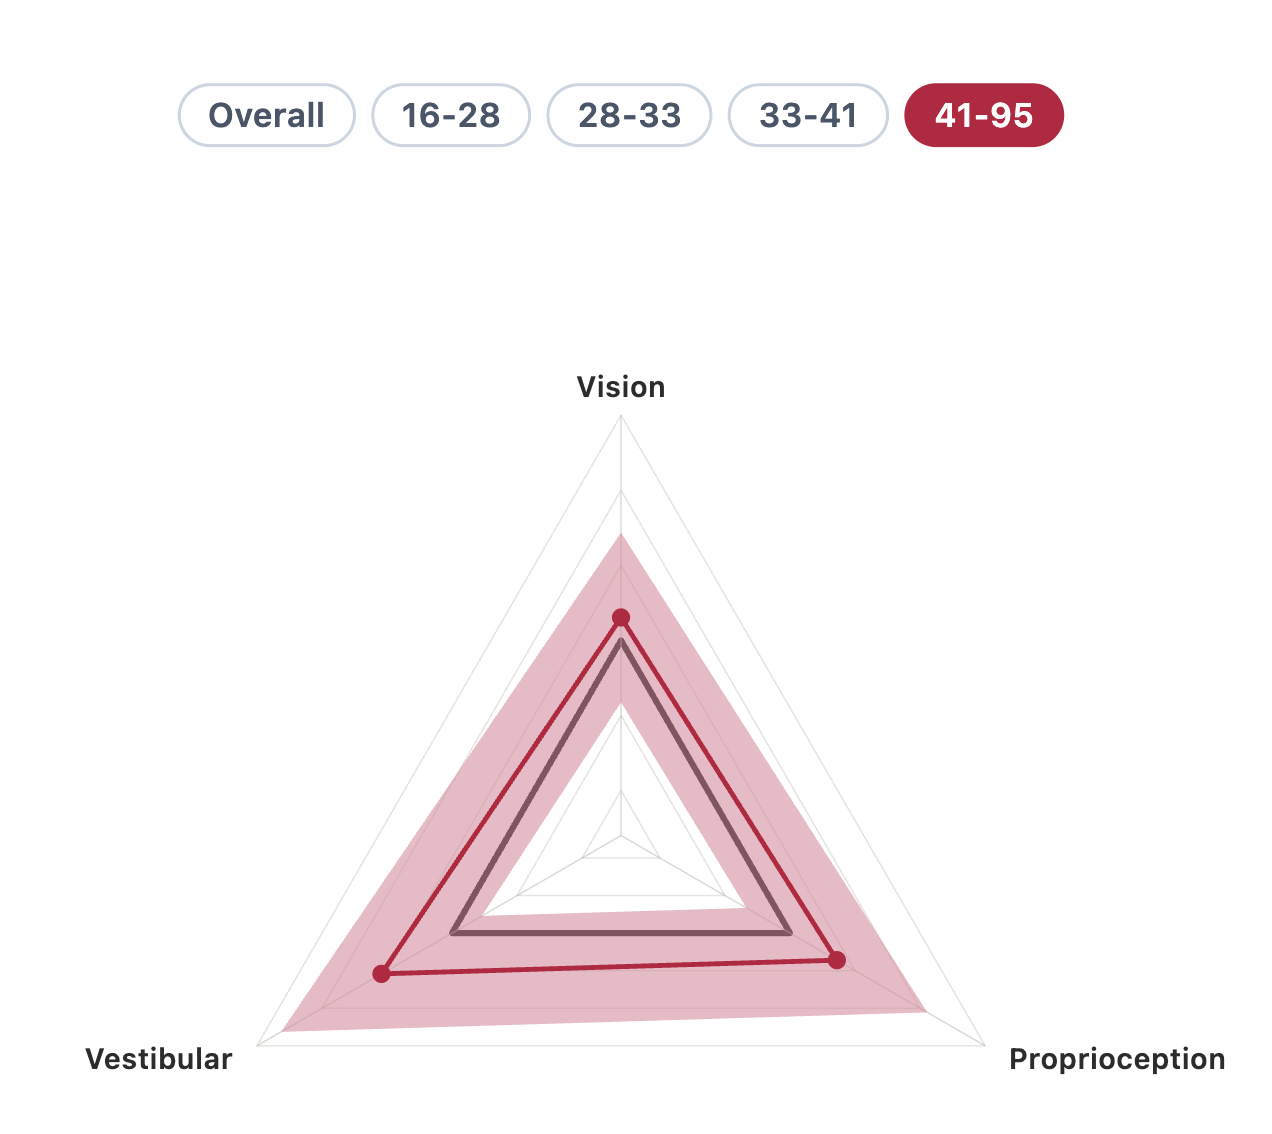
A note on availability: the condition radars earlier in this report are part of Wobble's coach dashboard. This sensory triangle isn't in the app yet — it's planned for a future update, where it will be available to any user who opts in.
Why "early signals": small samples don't just miss differences — they tend to exaggerate them, and the ratios themselves wobble from one stand to the next, even in healthy people. The cohort grows with every upload; and to tame that stand-to-stand noise, the plan is to wait until you've done at least six checks and average across them before showing your comparison — a handful of stands smooths out the jitter a single check can't.
2.4 · How it feels vs. what we measure
After each round, people can rate how steady they felt, 1 to 10. Lining those ratings up against the measured sway shows something very human: people rate on a single absolute scale. A foam-eyes-closed round feels shaky and gets rated low — even when it's that person's personal best for the hardest condition.
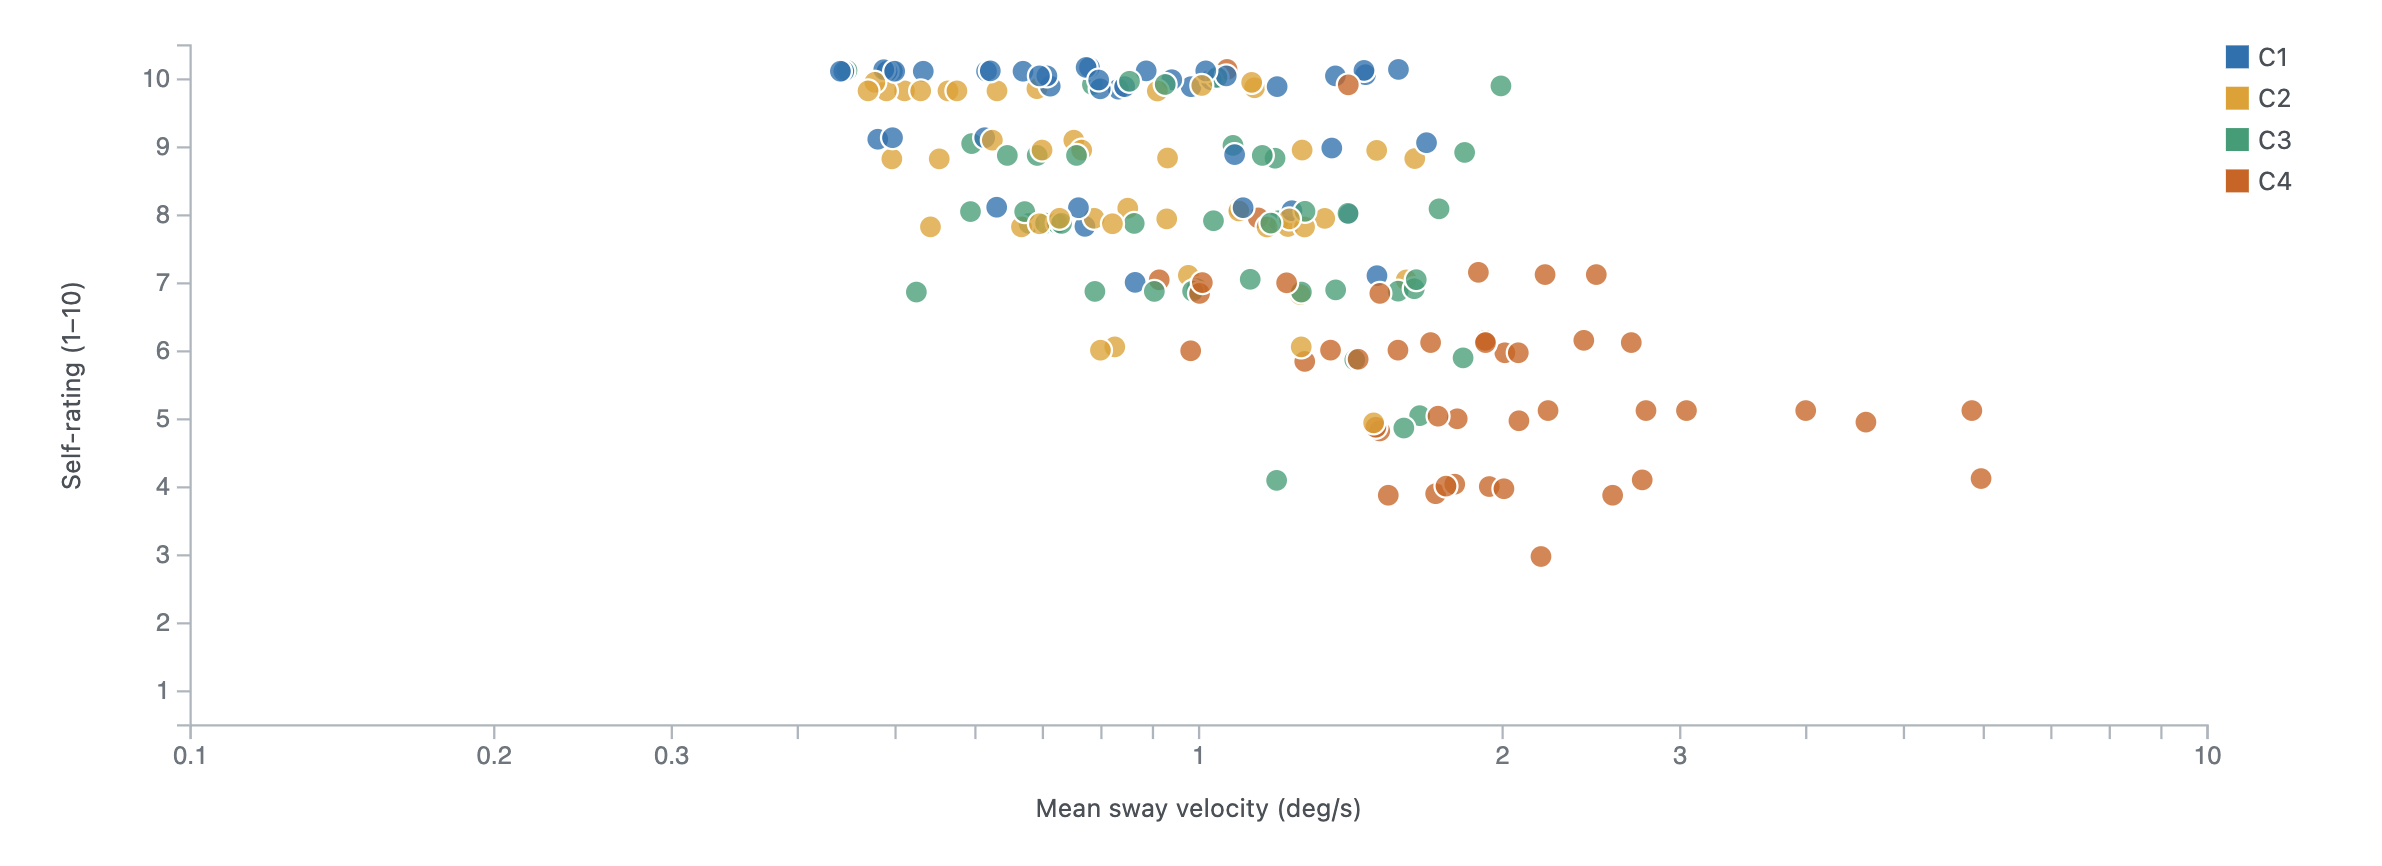
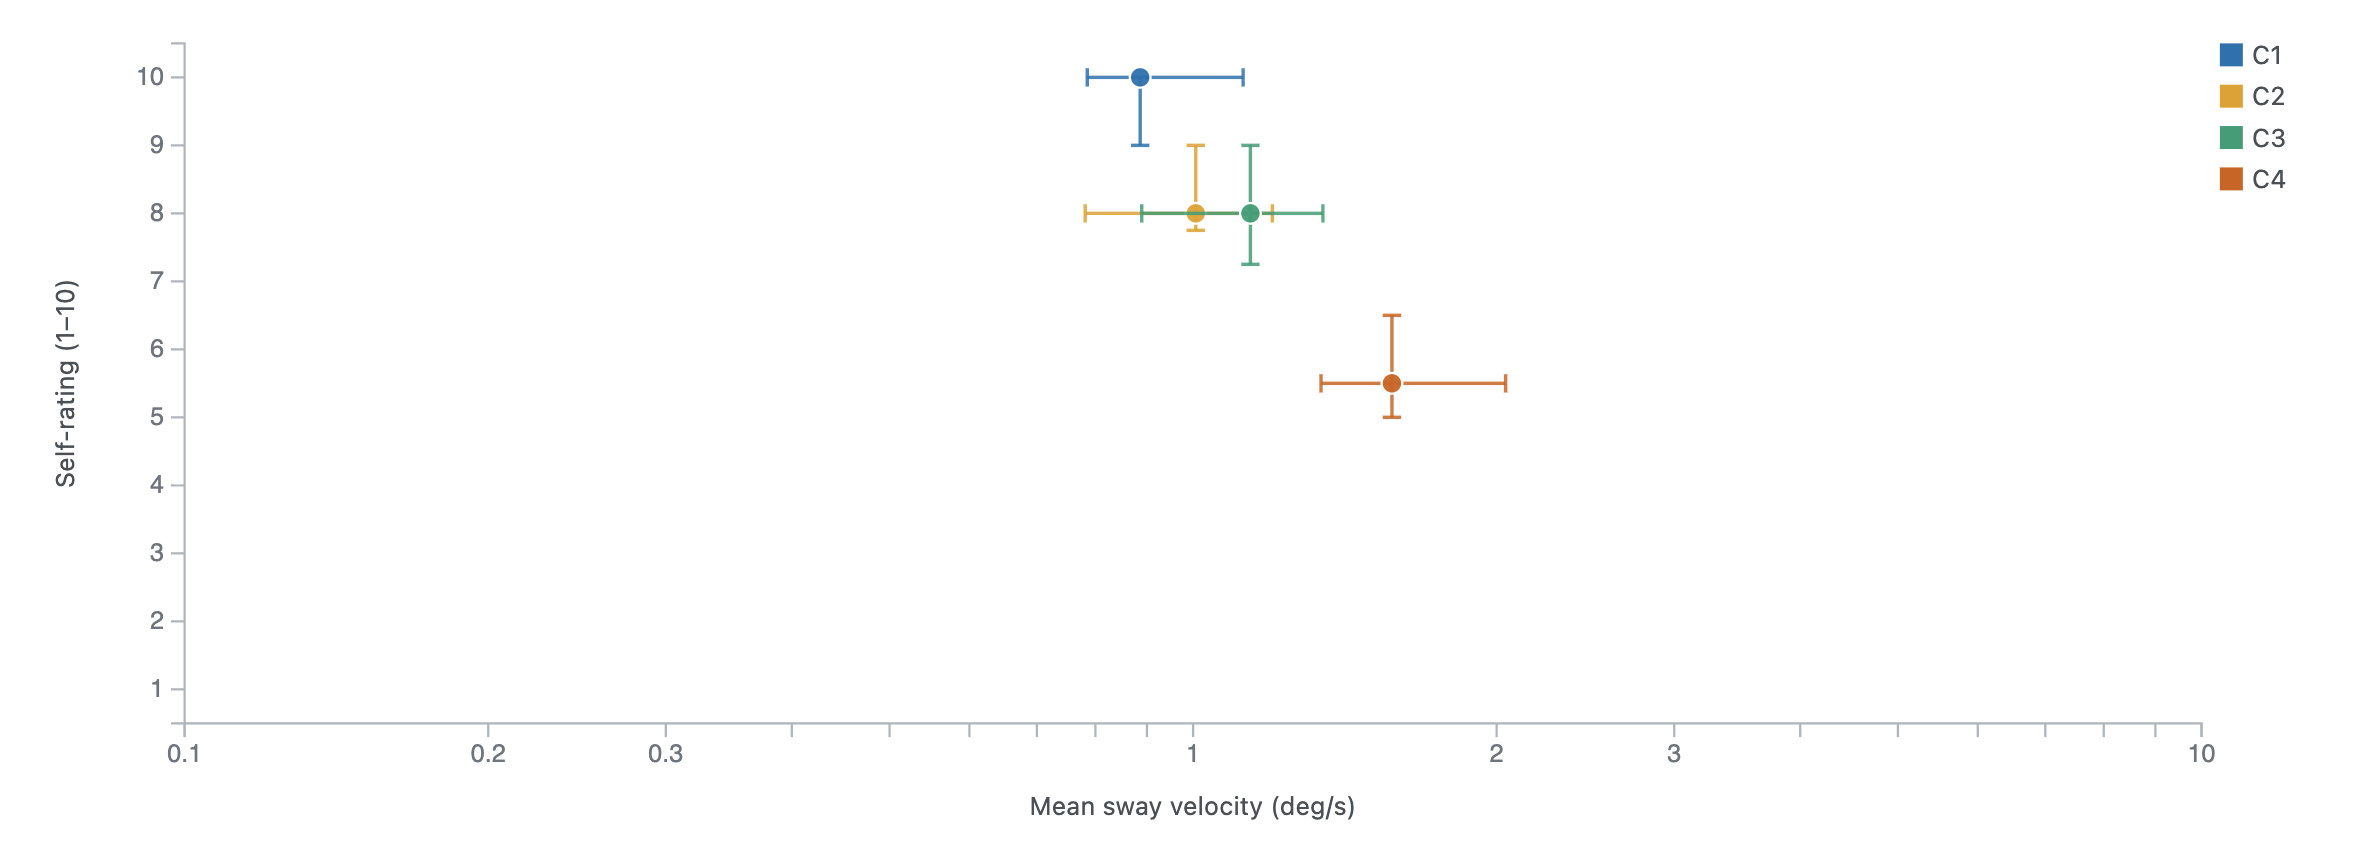
There's a telling detail in that easy corner. On the simplest round — firm ground, eyes open — almost everyone rates themselves a 9 or 10, no matter what the sensors record. The data backs it up: those top scores pile against the ceiling and barely move with measured sway, so the rating can't tell steady from rock-steady. On easy footing we simply don't notice our own balance — which is part of why a quick, repeatable check is worth doing: it shows what the feeling alone tends to miss.
It's a small but persistent pattern, and it holds within a single person's four rounds — so it doesn't need a big cohort to show up.
2.5 · Why one check is a snapshot, not a verdict
Stand twice and you won't get identical numbers — real bodies vary minute to minute. Some measures are rock-steady on a repeat; others are noisier. Here is roughly how reproducible each one is, from published test–retest studies1 (most dependable first):
| Measure | How reproducible on a repeat |
|---|---|
| Jerk — smoothness | Highest |
| Speed — busy-ness | Very high |
| Zone — area | Good |
| Spread — drift | Good |
| Rhythm — frequency | Moderate |
So why does Wobble ask for just one short check? Because the best test is the one people actually do. A single two-minute check is quick, needs no equipment, and is easy to repeat — and repeating it is exactly what turns a noisy snapshot into a trustworthy trend. One check tells you where you are today; a handful over weeks tells you which way you're heading.
3 · What's next
Balance and age — what we see, and why we won't call it yet
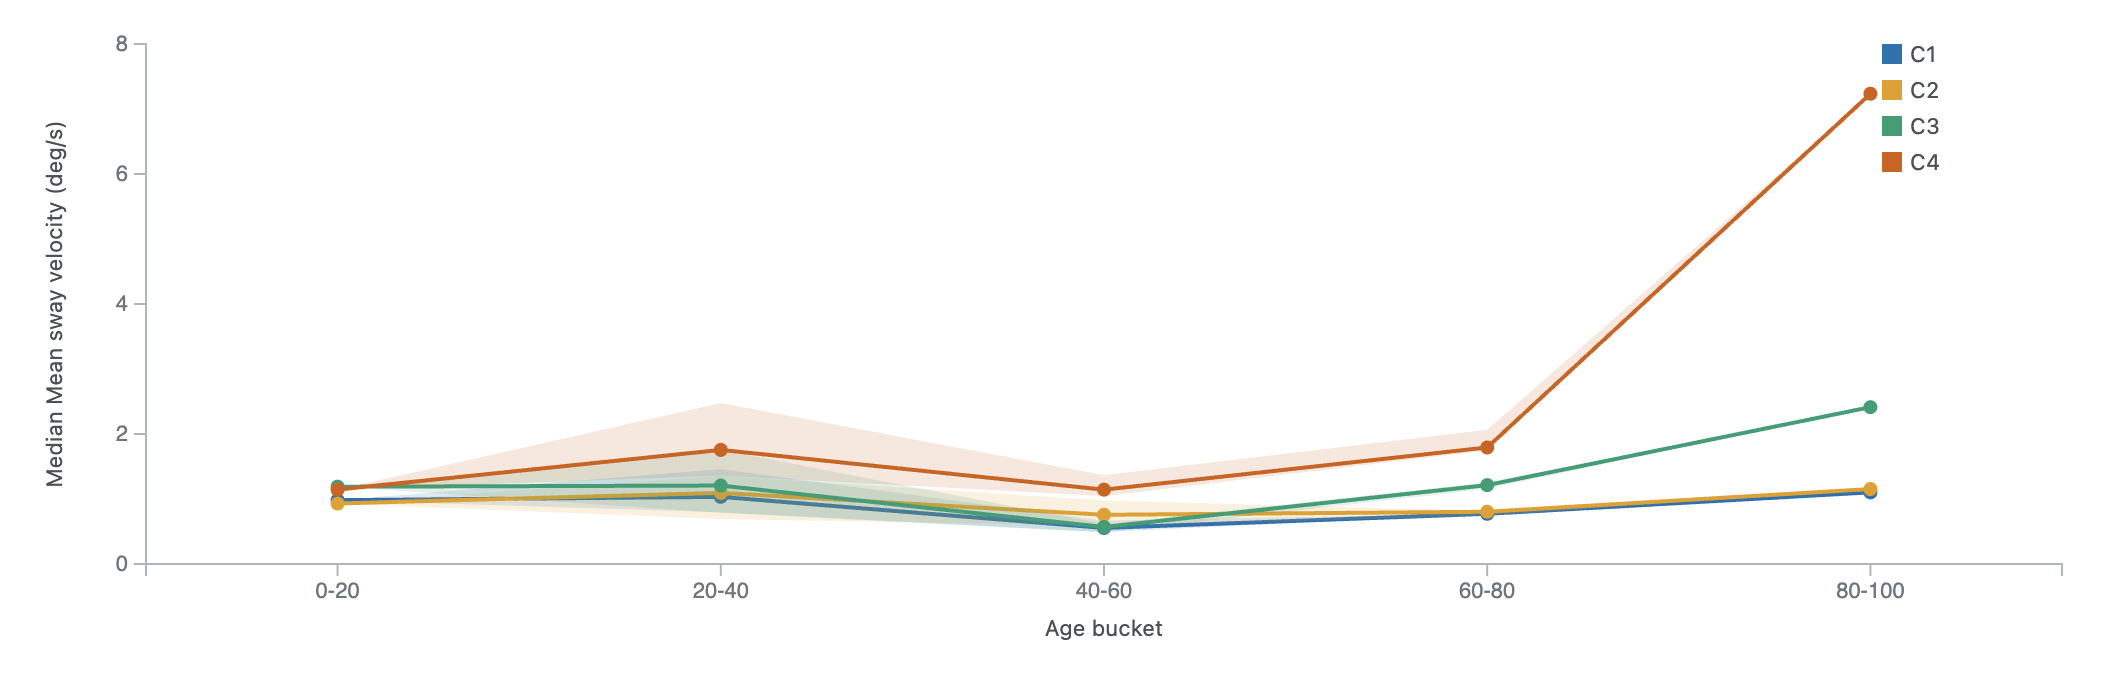
The headline question almost everyone asks is: does balance get worse with age? The expectation, well established in the literature, is yes — and in a specific, telling shape that we unpack below.
Our data so far hints at exactly that: the firm-ground rounds — eyes open (C1) and eyes closed (C2) — stay low and flat across every age band, while the hardest round, foam with eyes closed (C4), rears up in the oldest group. It looks like a textbook age effect — and that is precisely why we won't claim it.
What the published literature reports — and the shape our own curve should eventually match:
- As you get older, sway speeds up. Standing still, an older body drifts a little faster than a younger one. It doesn't happen overnight — it starts quietly in mid-life and picks up after about sixty.23 Of everything the check looks at, this speed is the clearest signal of age.4
- The easy rounds stay easy; the hard ones give way first. The revealing part isn't that everything declines — it's that the hard rounds decline faster, and the more senses you take away, the earlier age shows. The two foam rounds — foam, eyes open (C3) and foam, eyes closed (C4), the hardest of all — start to separate older from younger people in the fifties; firm ground holds out until the eyes close (C2), in the sixties.5 Firm ground with your eyes open (C1) stays steady well into old age. The easy lines stay flat for years; the hard lines are the ones that climb.
- A little wobble is normal — a lot, less so. Closing your eyes always adds a bit of sway, even when you're young and steady; that's expected, not a warning sign.6 But the hardest round — foam with your eyes closed (C4) — is the real test: in a large national study, more than a third of adults over forty couldn't hold it, and that share rose sharply with age.7 It's the same shape our own oldest-age spike hints at — though with a single 94-year-old in that band, it echoes the research rather than proving anything of our own.
That's the picture large studies of healthy people paint. We'll hold our own numbers up against it — and revisit the spike above — once enough older users have taken the check.
There's a deeper reason to measure rather than guess: people are often poor judges of their own balance. In one study, one in five older adults at high measured risk of falling didn't see themselves as at risk at all8 — the slide is gradual and easy to miss, which is exactly why a quick, repeatable check earns its keep.
Help the picture sharpen
Every honest gap above closes the same way: more checks, from more people. If you'd like the faint lines to become real findings, the best thing you can do is take the check yourself and opt in to share it — anonymously, no account, age only.
Your uploads are anonymous and opt-in. See the privacy policy for exactly what is and isn't shared.
Want a closer look at your own balance?
If you'd like a deeper, personal read of your results, get in touch and we'll connect you with a personal coach. They can walk through your data with you one-on-one and put together a plan tailored to you.
Notes & references
- Reproducibility tiers simplified from test–retest ICCs in Mancini M, Salarian A, Carlson-Kuhta P, et al., “ISway: a sensitive, valid and reliable measure of postural control,” Journal of NeuroEngineering and Rehabilitation 9:59 (2012), doi:10.1186/1743-0003-9-59; front–back / side-to-side convention from Prieto TE, Myklebust JB, Hoffmann RG, Lovett EG, Myklebust BM, “Measures of postural steadiness: differences between healthy young and elderly adults,” IEEE Transactions on Biomedical Engineering 43(9):956–966 (1996), doi:10.1109/10.532130. ↩
- Wiesmeier IK, Dalin D, Maurer C, “Elderly Use Proprioception Rather than Visual and Vestibular Cues for Postural Motor Control,” Frontiers in Aging Neuroscience 7:97 (2015), doi:10.3389/fnagi.2015.00097. ↩
- Era P, Sainio P, Koskinen S, et al., “Postural balance in a random sample of 7,979 subjects aged 30 years and over,” Gerontology 52(4):204–213 (2006), doi:10.1159/000093652; Abrahámová D, Hlavačka F, “Age-related changes of human balance during quiet stance,” Physiological Research 57(6):957–964 (2008), doi:10.33549/physiolres.931238. ↩
- Prieto et al. (1996, n. 1); Roman-Liu D, “Age-related changes in the range and velocity of postural sway,” Archives of Gerontology and Geriatrics 77:68–80 (2018), doi:10.1016/j.archger.2018.04.007. ↩
- Choy NL, Brauer S, Nitz J, “Changes in postural stability in women aged 20 to 80 years,” The Journals of Gerontology Series A 58(6):M525–M530 (2003), doi:10.1093/gerona/58.6.m525. ↩
- Brech GC, Bobbio TG, Cabral KdN, et al., “Changes in postural balance associated with a woman’s aging process,” Clinics (São Paulo) 77:100041 (2022), doi:10.1016/j.clinsp.2022.100041. ↩
- Agrawal Y, Carey JP, Della Santina CC, Schubert MC, Minor LB, “Disorders of balance and vestibular function in US adults: NHANES 2001–2004,” Archives of Internal Medicine 169(10):938–944 (2009), doi:10.1001/archinternmed.2009.66. ↩
- Delbaere K, Close JCT, Brodaty H, Sachdev P, Lord SR, “Determinants of disparities between perceived and physiological risk of falling among elderly people: cohort study,” BMJ 341:c4165 (2010), doi:10.1136/bmj.c4165. ↩